If OMERO.parade is not responding at launch, you may need to reload the page. To do so , please hold simulaneously ctrl maj R (or clean the recent history for omero.epfl.ch website, including cookies).
¶ Description
OMERO.parade is a metadata-mining plugin for OMERO webclient. It enables access to the metadata of images in OMERO for plotting, display and filtering of images. Supported metadata includes number of ROIs, Key-Value pairs, and data stored in OMERO.tables or in .csv files.
¶ Requirements
-
You need to have a dataset with images
-
You need to attach ONE OMERO.table to the dataset and/or one or more .csv files. Parade does not support multiple OMERO.tables but can support multiple csv files.
We suggest you to follow steps provided in OMERO-Fiji - batch proocess - example 1. The following example is based on the results of this example.
To generate parade-compatible OMERO.tables, you can also have a look to the OMERO.tables - Tables on dataset level to know how to create such OMERO.tables.
To generate csv files, please have a look to the next section Create a csv file compatible with OMERO.parade
- You also need to drag-drop the dataset outside any project (put it at the root).
¶ Step-by-Step
¶ Filter images based on analysis data
- Select the
Edu RFPdataset. - Drag and drop it in the hierarchy so that it is not included in a project.
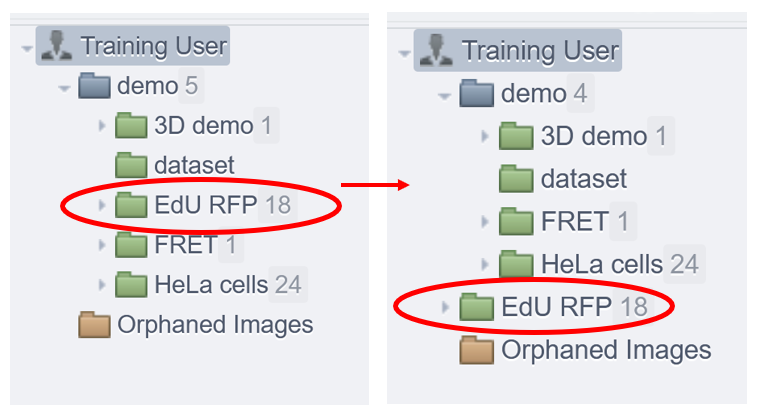
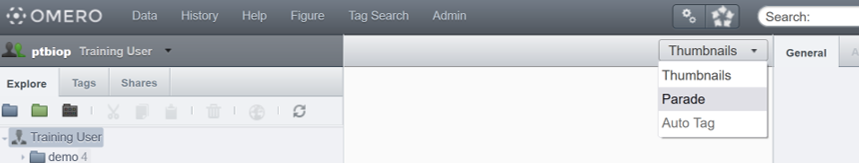
- Choose the
Paradeoption in the centre panel dropdown menu from webclient's main page.
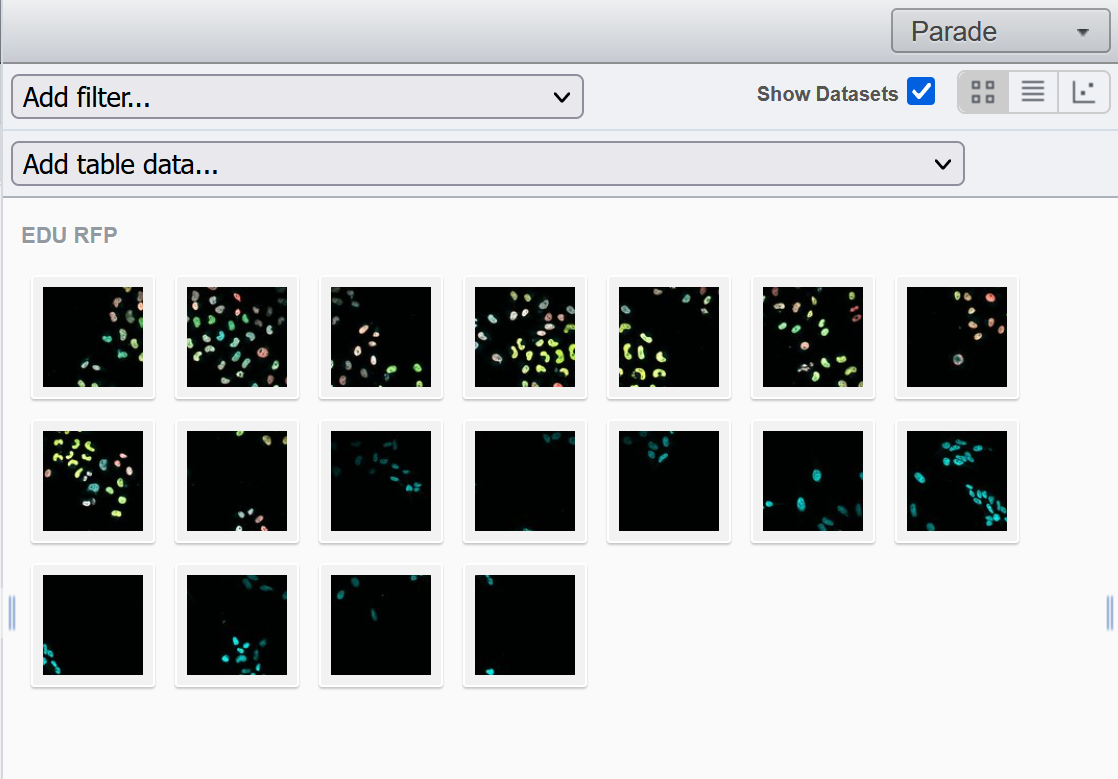
- In the
Add filterselection box, selectEdU_RFP_Summary.csv - Select data from the result table using the drop-down menu (i.e PosCellCount3) and drag the slider to filter the Images.
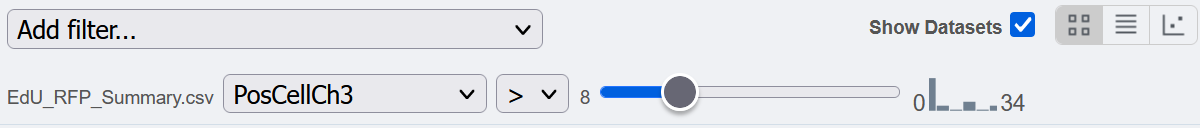
Note : It is possible to add more filters on tags, key-value pairs... to fine-tune the research.
¶ Create a dynamic scatter plot of your dataset based on analysis data
Make sure that you have only one OMERO.table attached to the dataset. If there is more than one, OMERO.parade will crash.
If you want to analyse more than one table, you can use multiple csv files. See the chapter below Create a csv file compatible with OMERO.parade.
- In Parade menu, remove all filters by hitting
Xand change the OMERO.parade layout to Table (middle button located under the Parade dropdown menu)
Make sure that the dataset your want to analyse is outside a project

- In the selection box
Add table data…, select :Table_%Area,ROI_count,Table_PosCellCount2,Table_PosCellCount3.
Note that it is currently not possible to remove a column.
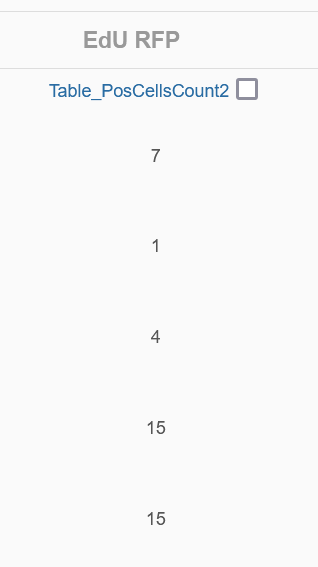
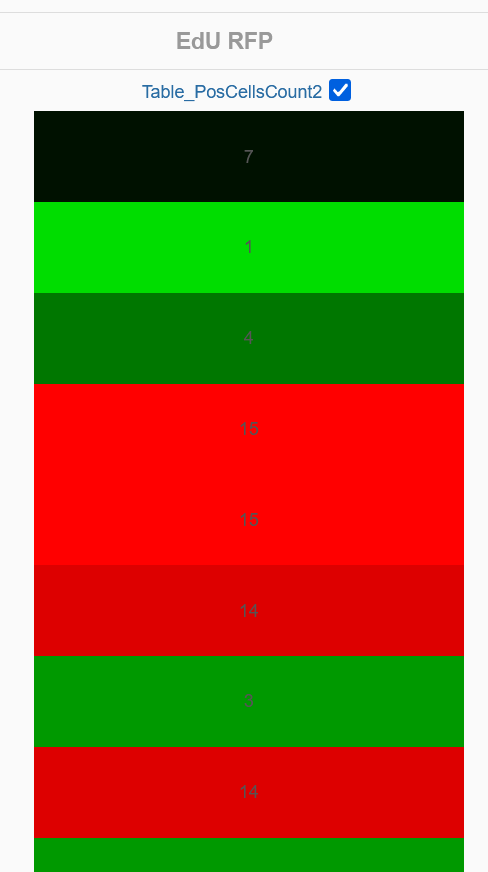
- Click on the name of a column to sort it
- Check the checkbox in each column to show the Heatmap. Note the corresponding pattern in the Heatmap.
-
Switch to the Plot layout (third button located under the Parade dropdown menu)

-
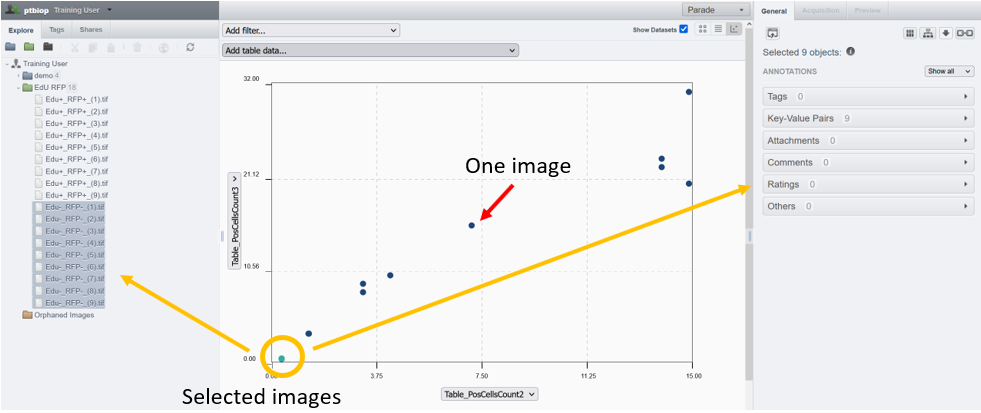
It takes the first 2 columns of pre-selected table data to create a scatter plot. Each point corresponds to an image from the dataset.
-
Filters can be added to plot only the relevant results. (See above part Filter images based on analysis data
-
Try to dynamically change the axes: select
Table_PosCellCount2andTable_PosCellCount3 -
Click on a point to select an outlier, or draw a rectangle by dragging your mouse to select several outliers at the same time. Images are selected in the left-hand pane.
-
Selected images can be annotated using the options from the right-hand pane, viewed with the iviewer, or even opened in OMERO.figures!
Closing a Dataset in the left-hand tree removes the values from the plot. You need to keep the dataset expended.
It is not possible to export the graph neither to integrate it on OMERO.Figure. The only thing you can do save it is a screenshot.
¶ Create a csv file compatible with OMERO.parade
OMERO.parade is not designed to hold multiple OMERO.tables at the same time but it allows for reading multiple csv files. Each csv file should have one row per image within the dataset.
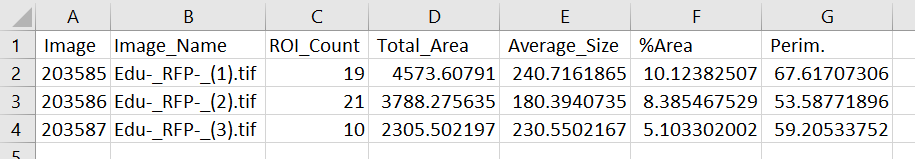
Each of your csv file has to be formatted with :
- headers on the first row
- one column containing each image ID (with header Image)
- one column containing each image name (with header Image_Name)
- other columns containing data (separate each token with _)
You can find an example in my_csv_parade.csv
- Attach your csv files to the dataset they are referring to
- Drag-drop the corresponding dataset outside any project.
You can then follow the previous steps and pick values from your different csv tables.
Be careful : You will not be able to use
Populate_Metadata.pyscript to generate an compatible OMERO.table from the csv file you've just created. The script will generates you an OMERO.table but all fields will be considered asStringvariables. Therefore, no values will be added on the graph because it requires to have numeric fileds. If you want to generate an OMERO.table using that script, please refer to the OMERO.Tables Wiki page.
¶ Examples
¶ Best usage of OMERO.tables and CSV files
Example Dataset on OMERO, including the Groovy script to generate the tables.
To benefit from an optimal user experience, we suggest you to use, attached to a dataset :
-
CSV files : they are used in OMERO.parade. You have no limit on the number of files to use in this plugin. They must be formatted as mentionned in the above section. You can create an OMERO.table using our script "UTILS_table_create_from_csv.groovy".
-
OMERO.tables to have a quick preview of all your data and to be able to visualize them in the table harmonica of each image. Do not use them in OMERO.parade and you can add to the dataset more than one OMERO.table ; each of them readable in the table harmonica of each image.
¶ Only CSV files
Example Dataset on OMERO, including the Groovy script to generate the tables.
If you attach one or more csv files to the dataset, but no OMERO.tables
- You will be able to use OMERO.parade if the csv files are correctly formatted.
- You will not be able to visualize image features in the table harmonica because only OMERO.tables can be read.
¶ Only OMERO.tables
Example Dataset on OMERO, including the Groovy script to generate the tables.
If you attach one OMERO.table to the dataset, but no csv files
- You will be able to use OMERO.parade
- You will be able to visualize image features in the table harmonica.
If you attach more than one OMERO.tables to the dataset, but no csv files
- You will NOT be able to use OMERO.parade because it doesn't support multi-tables.
- You will be able to visualize image features of each table in the table harmonica.