¶ Create an OMERO.Figure
If the OMERO.Figure app is slow and slowes down your computer, and if you are on MAC systems, this might be due to the ICloud password extension manager, installed in your web browser, that tries to fill all textboxes. In order to speed-up OMERO figure and remove the lag, you can deactive the extension.
¶ Setup your page
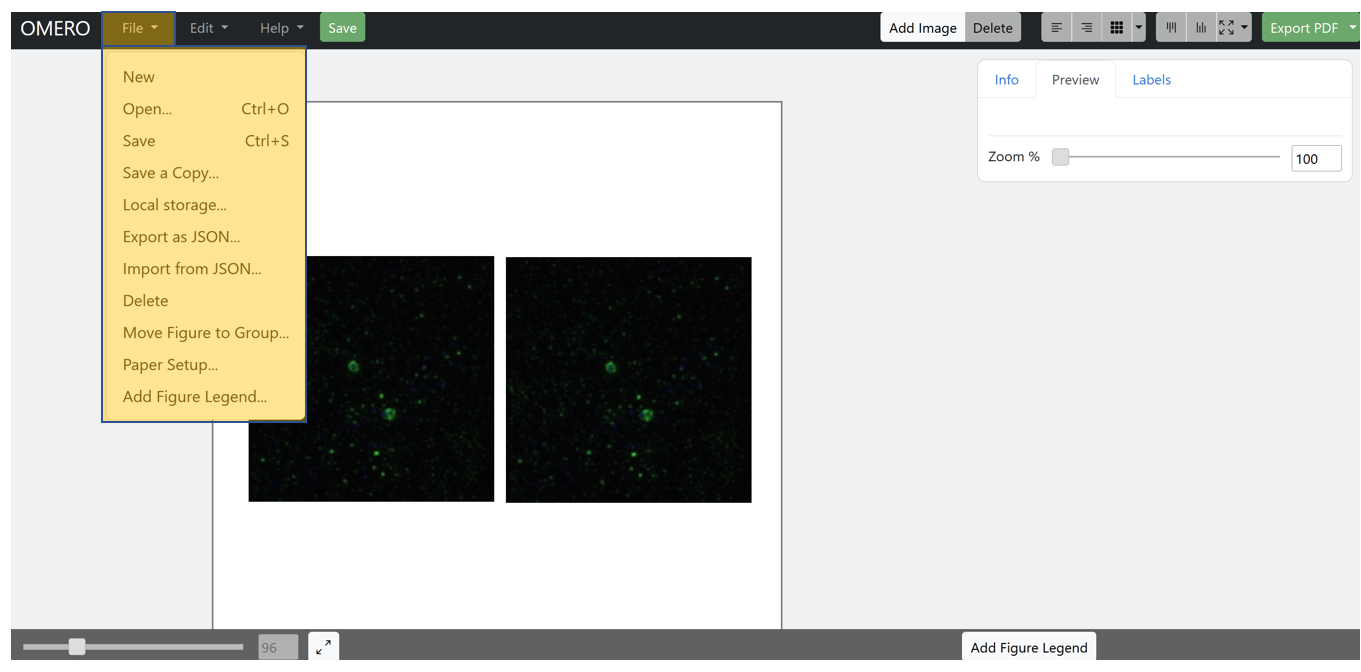
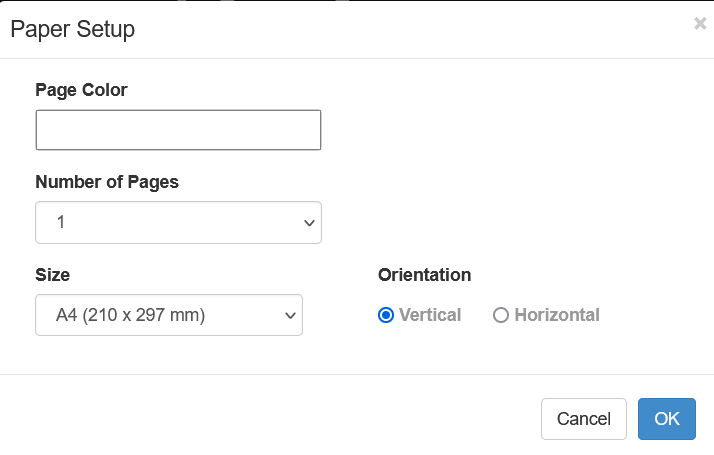
Under File->Paper setup...
- You can change the page format from A4 (default) to other
- You can change the background color of your figure
- You can add more pages to your figure (1 page by default)
¶ Manage images
¶ Add an image
- Click on the button
Add imageon the top left hand side - On the popup window, enter the ID of the image you want to add to the figure
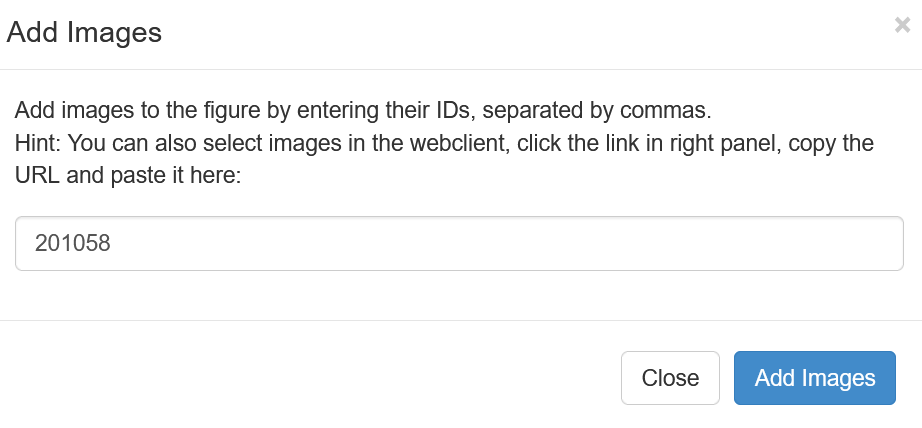
- Click on
Add images
¶ Reload existing images
If you update the channel names on OMERO, the new names are not automatically updated on Figure. To update them:
- Click
File -> Reload images...
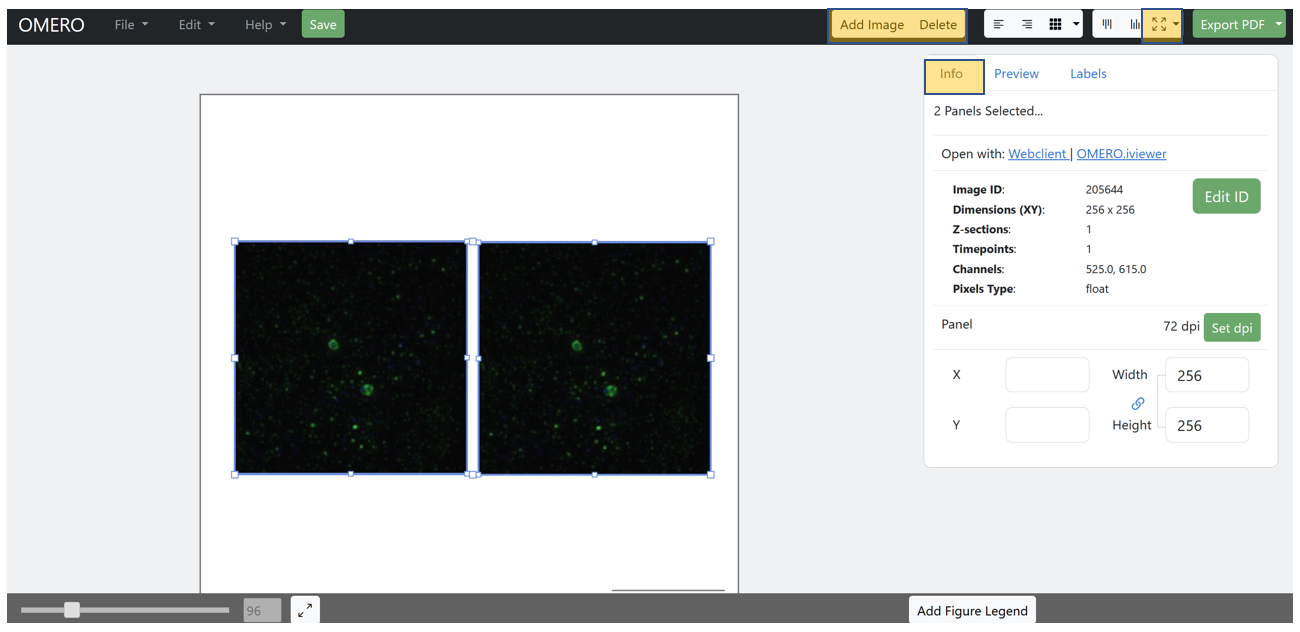
¶ Replace images by another one
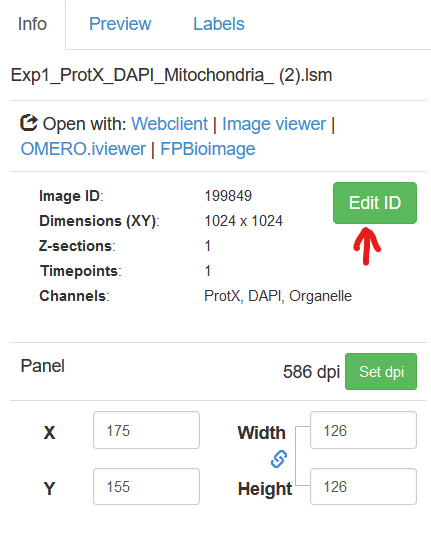
- Select the image you want to update
- On the
Infotab, click onEdit ID
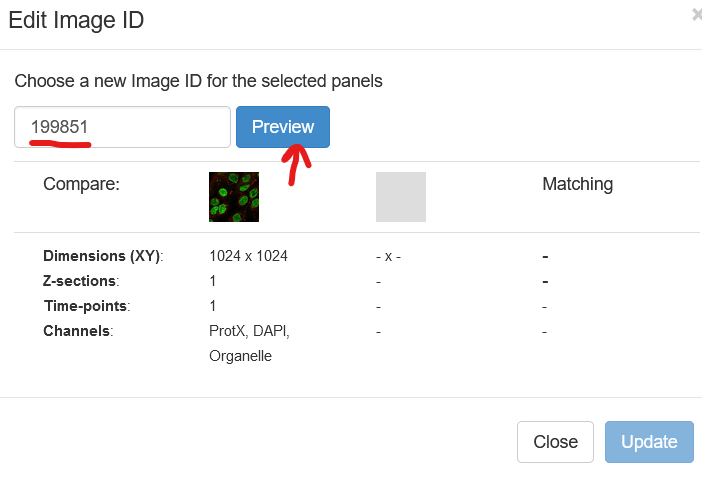
- On the popup window, enter the ID of the new image
- Click on
Preview.It should display green ticks if everything is ok.
- Click on
Update
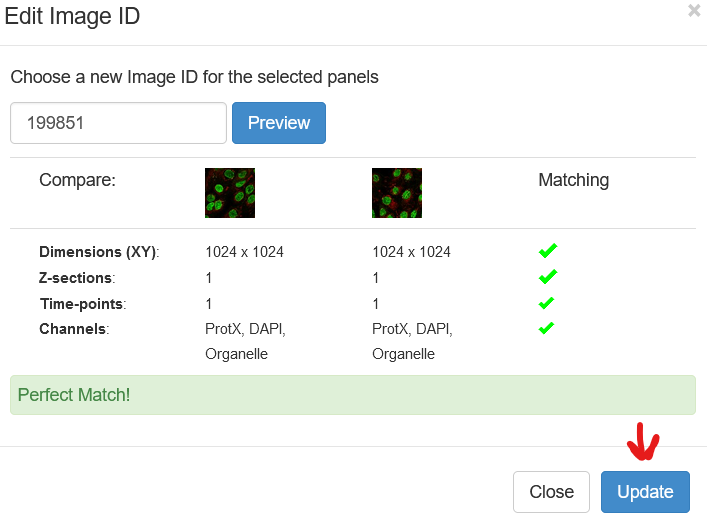
- The image is now changed.
Be careful : ONLY image dimensions are checked by OMERO. If you update with an image linked to different tag/key-value..., they will not be updated automatically
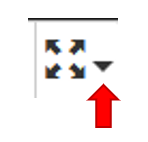
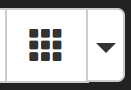
¶ Resize images
Click on the drop down menu
¶ To the same scale
- Having the scale bar with identical length on all your images, select your images and choose
Align Magnification
¶ To the width/height
- Having all your images with the same width or height, select your images and choose
Align WidthorAlign Height
¶ To the same scale
- Having all your images with the same width AND height, select your images and choose
Width & Height. - The zoom of the image is automatically adapted to not distort the image.
¶ Alignement features
- Select at least two images
- Align images to the left / right / top / bottom by clicking on the corresponding button
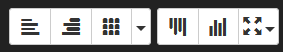
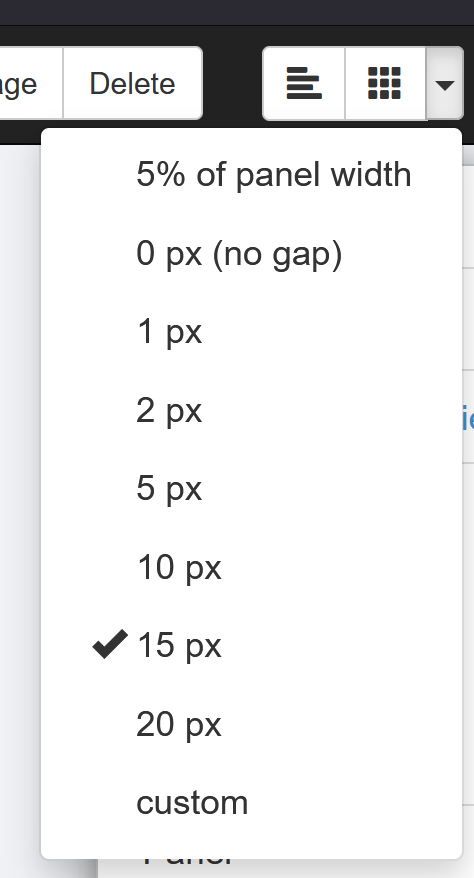
- if you want to align images to grid, with the same spacing between image, click on
For alignement to grid, you can choose the amount of space between images by clicking on the drop-dorw menu
, choosing the space and finally click again on the grid button.
¶ Preview features
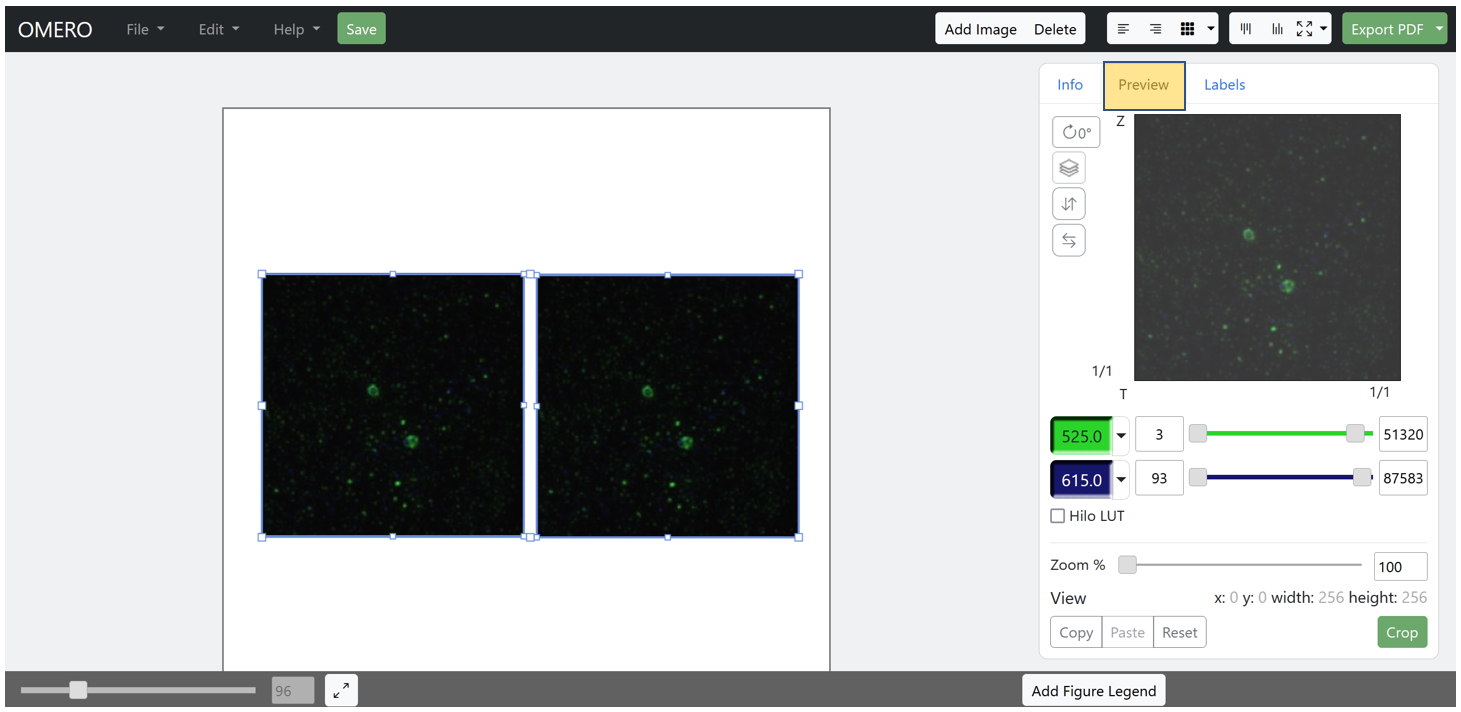
¶ Channels & intensities
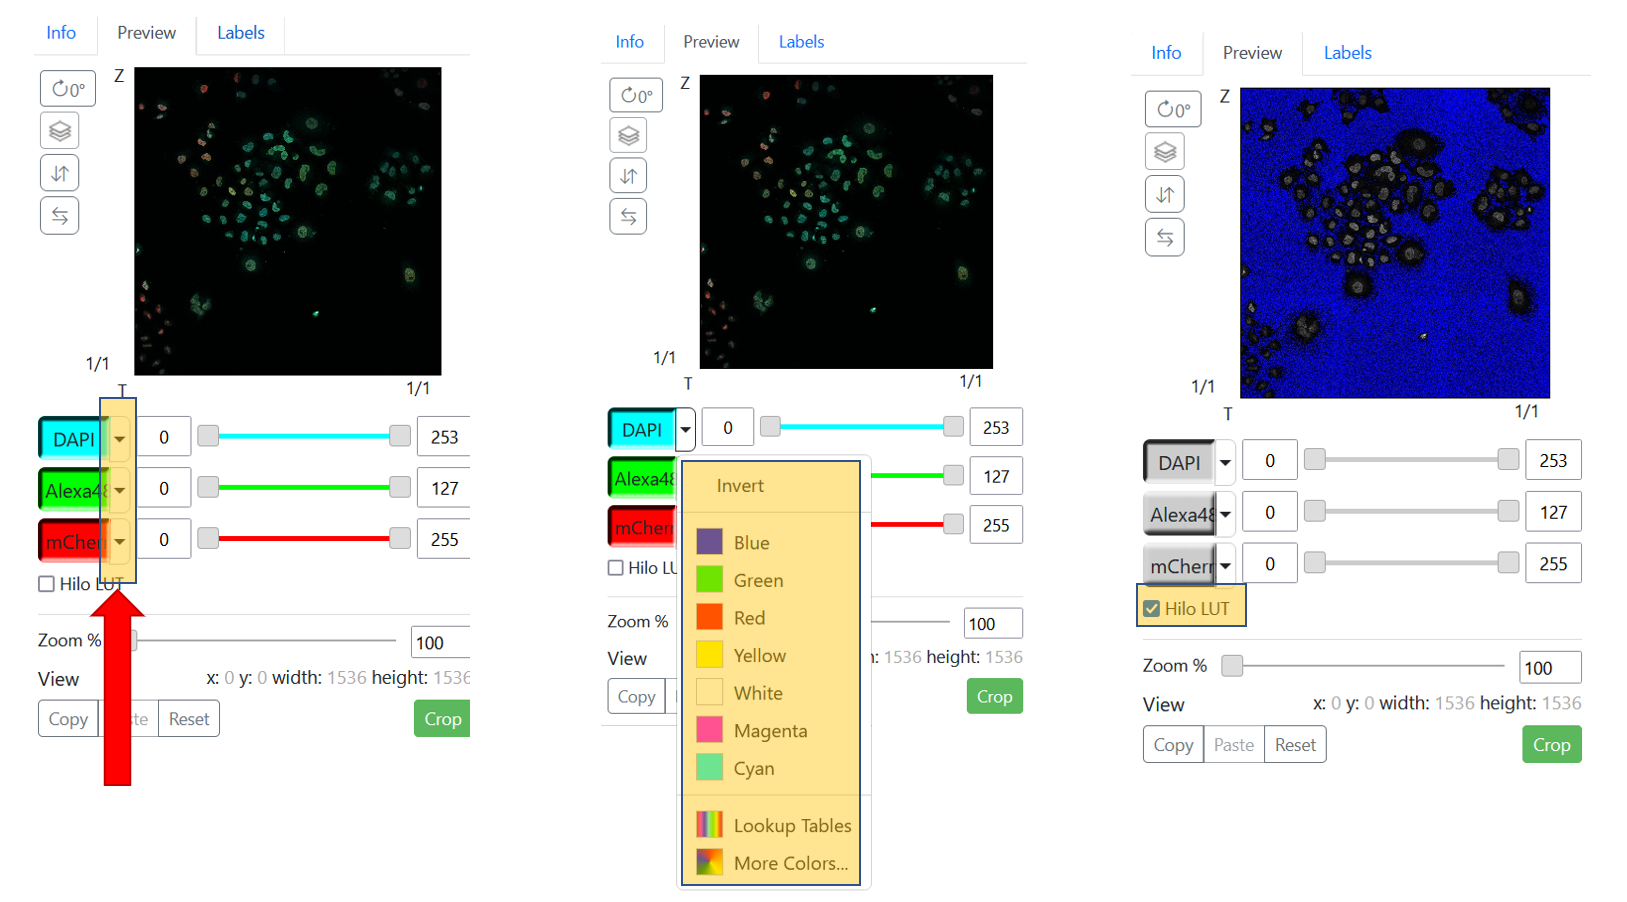
- To activate/de-activate one channel on the preview, click on the channel rectangle
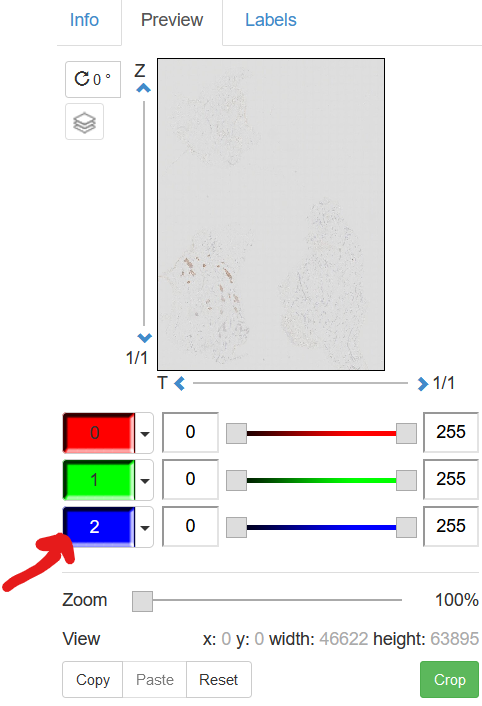
- To change the channel color, click on the left arrow and select the color
To quickly look at your image saturation, you can toggle the checkbox
HiLo, which activates the HiLo look-up table.
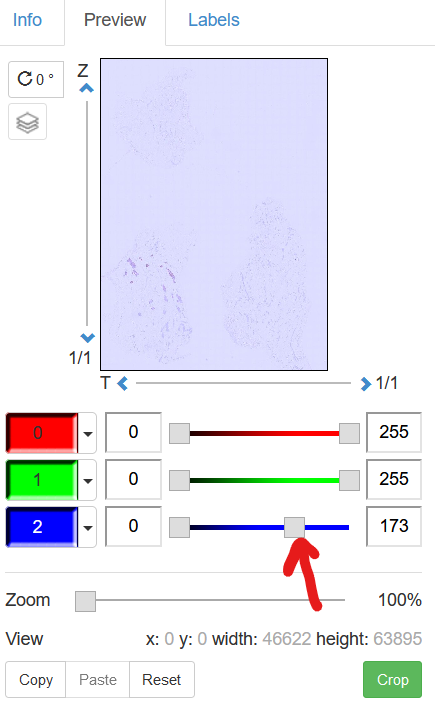
Important: In order to see the 'real' saturation of the image, one need to push the channel min/max values from 0 to max_value
- To change min/max values, move the sliders
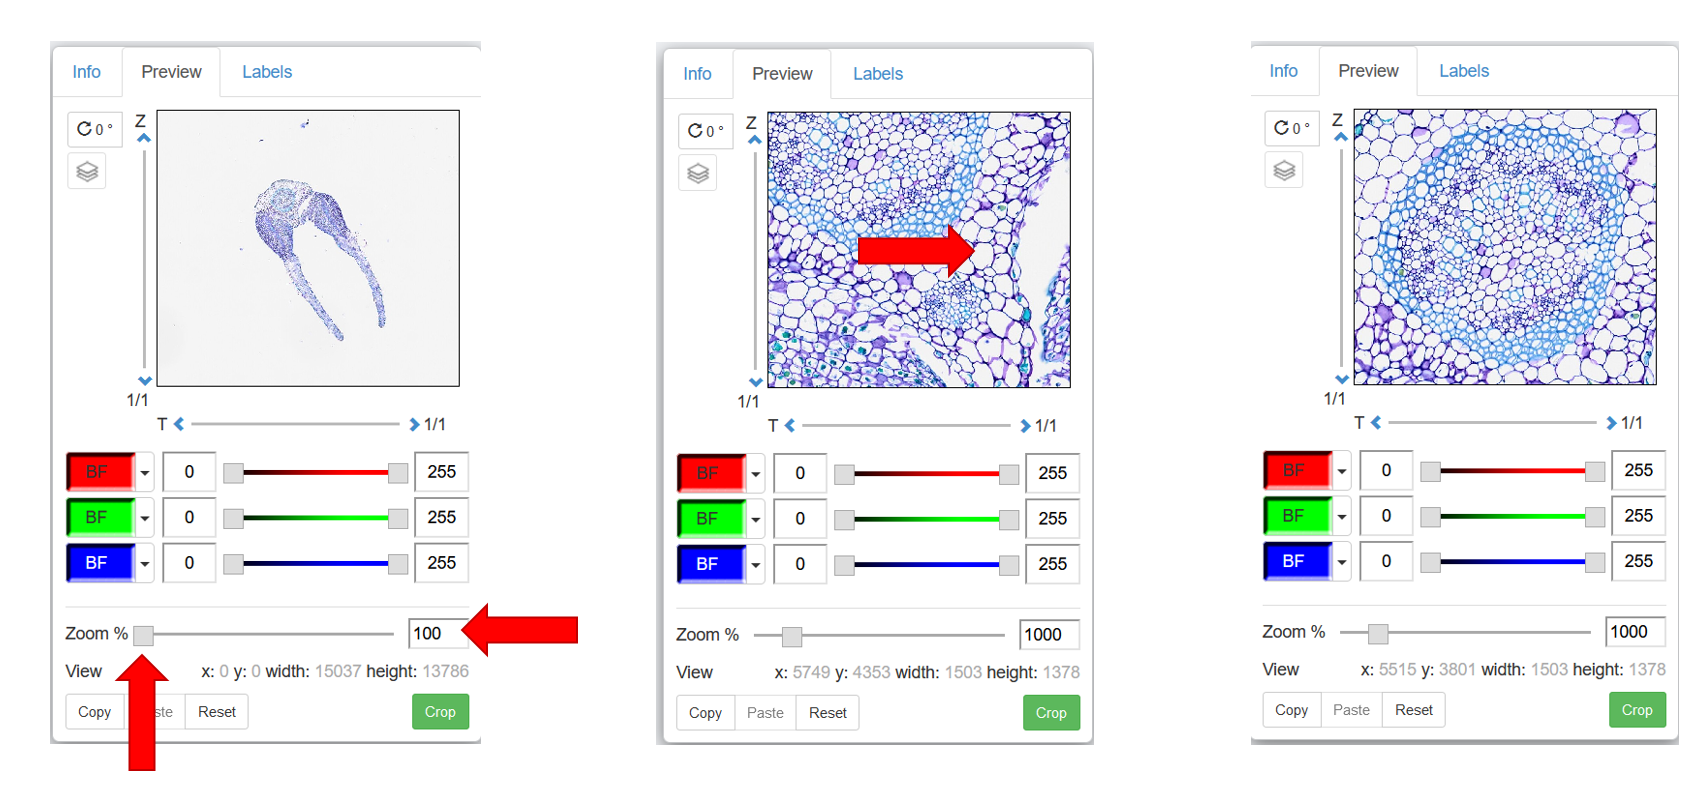
¶ Zoom
New feature : inset creation to make a synchronized crop of your image. See below
You can zoom on an image using the slider at the bottom the preview tab.
- By default, it zooms in the center of the image.
- To change the zoomed region, grab the image in the
previewpane and move it. - To fine tune the zoom factor
- Move the slider
- Enter the zoom value manually in the box
- Use the ↑/→ keyboard arrows to increase ; ↓/← arrows to decrease by 1%.
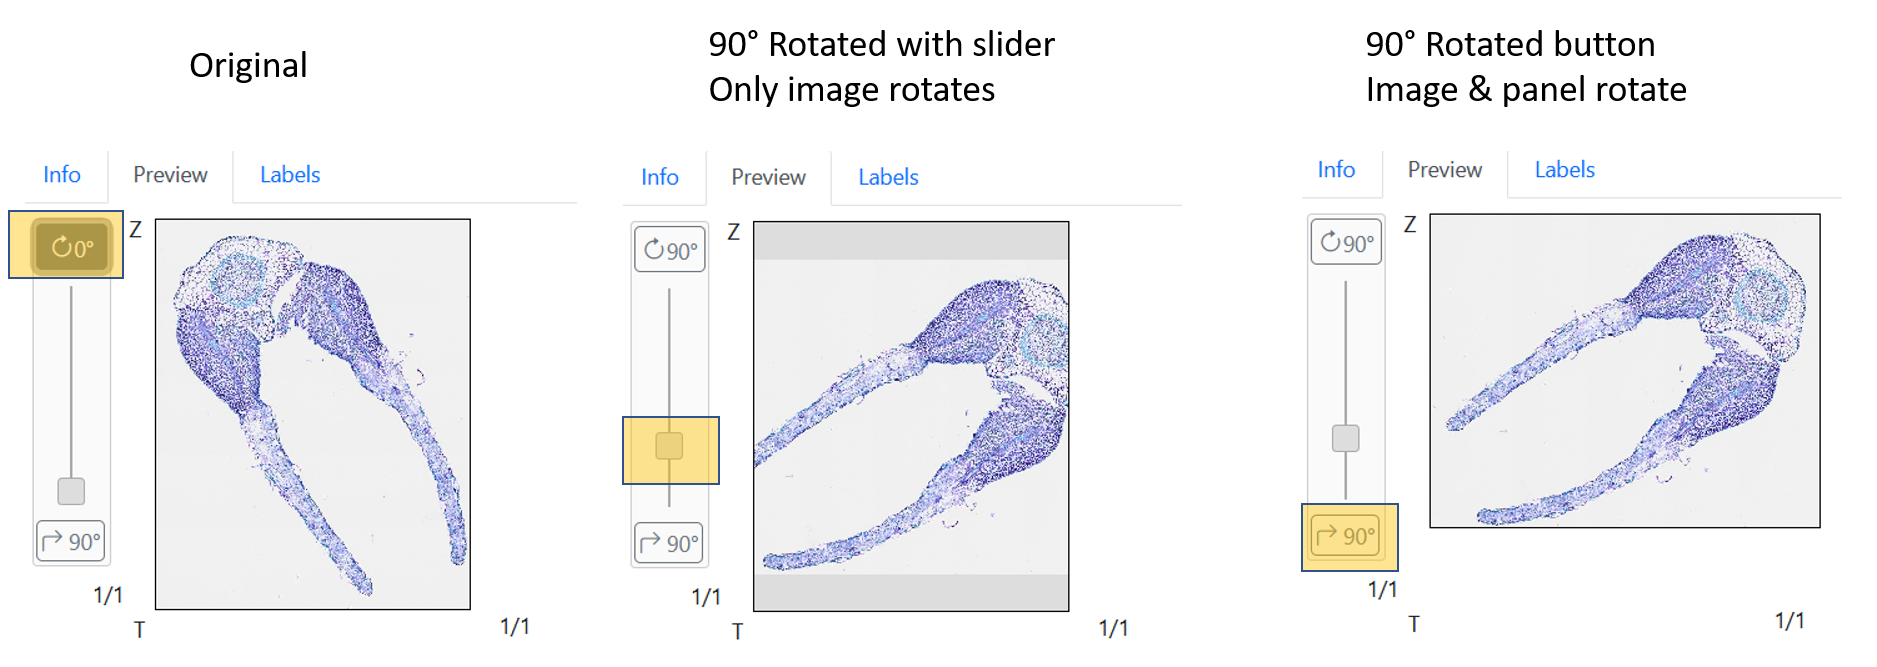
¶ Rotation
- To adjust image rotation, click on the
Rotatebutton and move the slider.
This will only rotate the image inside the panel, not the panel itself
- To rotate the image AND the panel together, click on the
Rotate 90°button
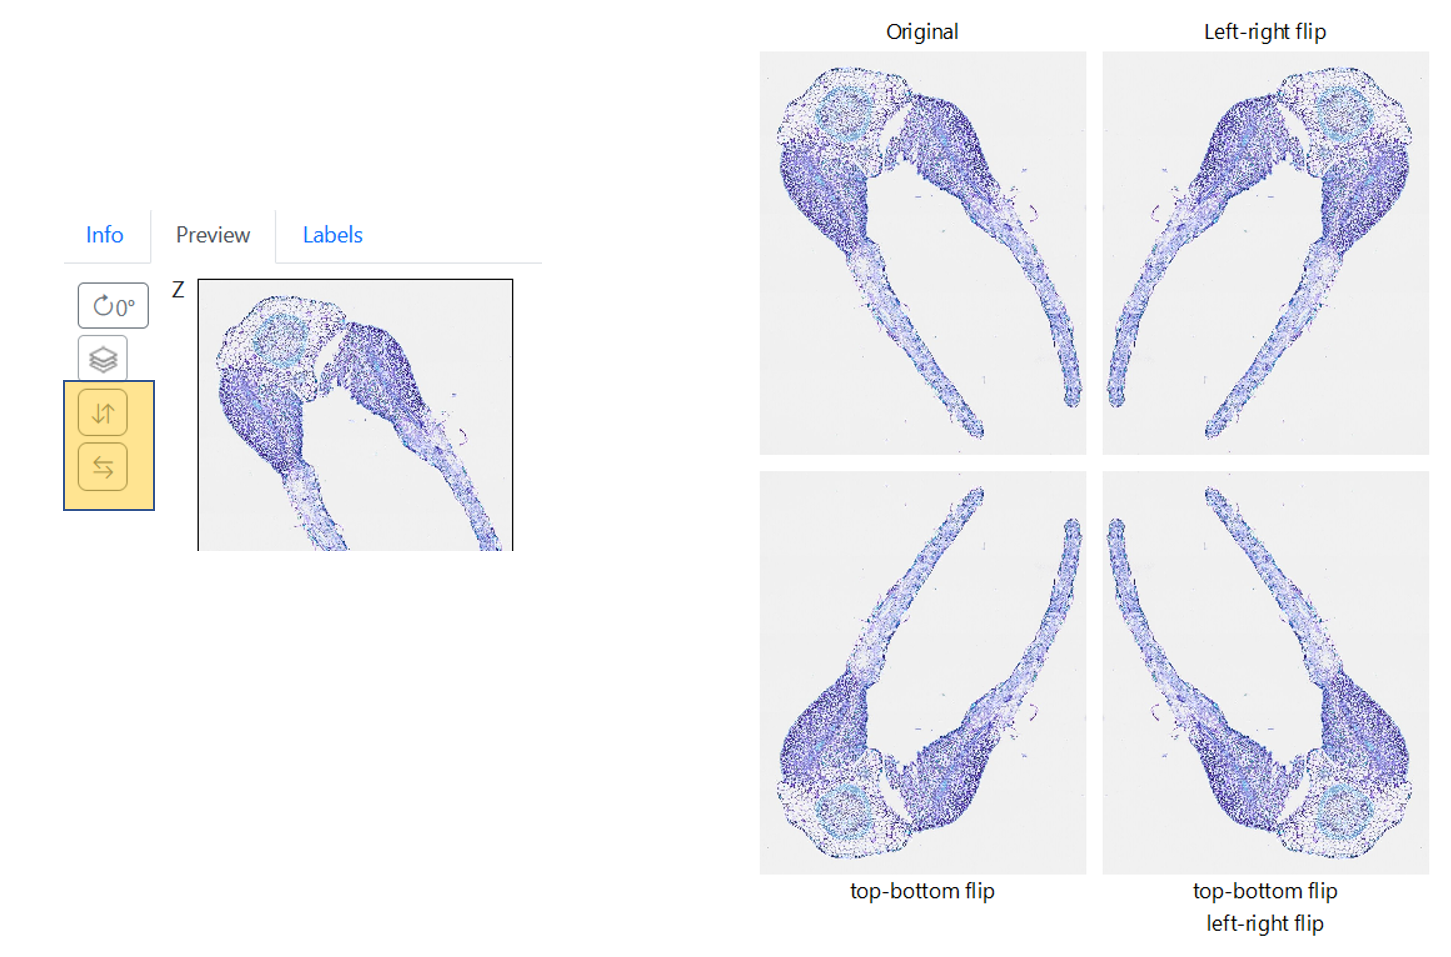
¶ Flipping
Use the ↑↓ buttons to flip the image left/right and / or top/bottom
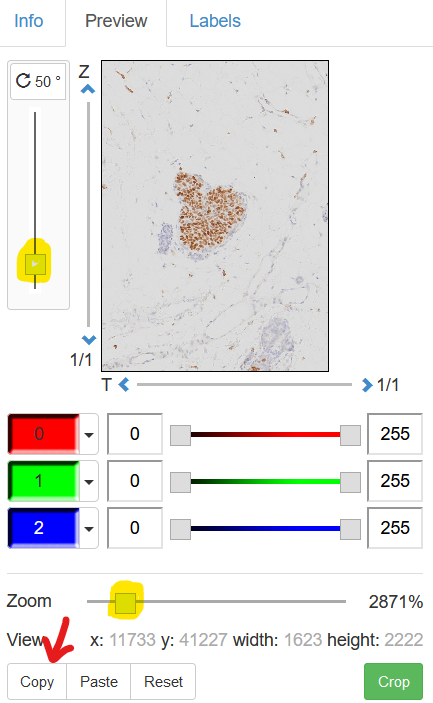
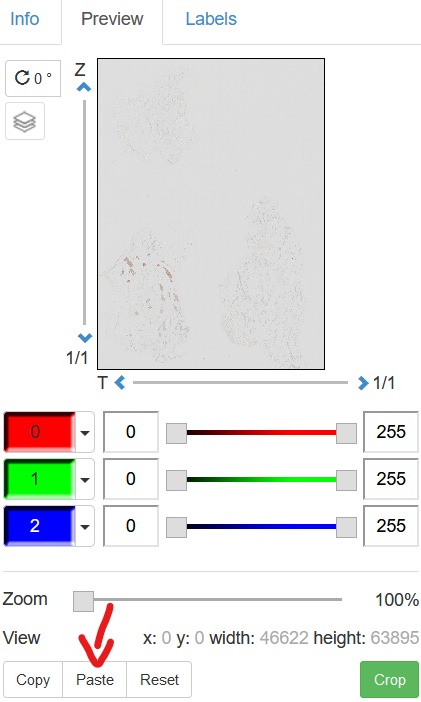
¶ Copy preview settings
- Adjust your zoom and rotation (displayed channels are not copied)
- Click on
Copyat the bottom of thepreviewpane - Select another image
- Click on
Paste.
¶ Grayscale
There isn't any built-in button to turn a panel to grayscale. However, you can do it in a few clicks
- Hide all channels on the image EXCEPT the one of interest
- Change the LUT to
white
¶ Manage ROIs
¶ Add ROIs
¶ Create new
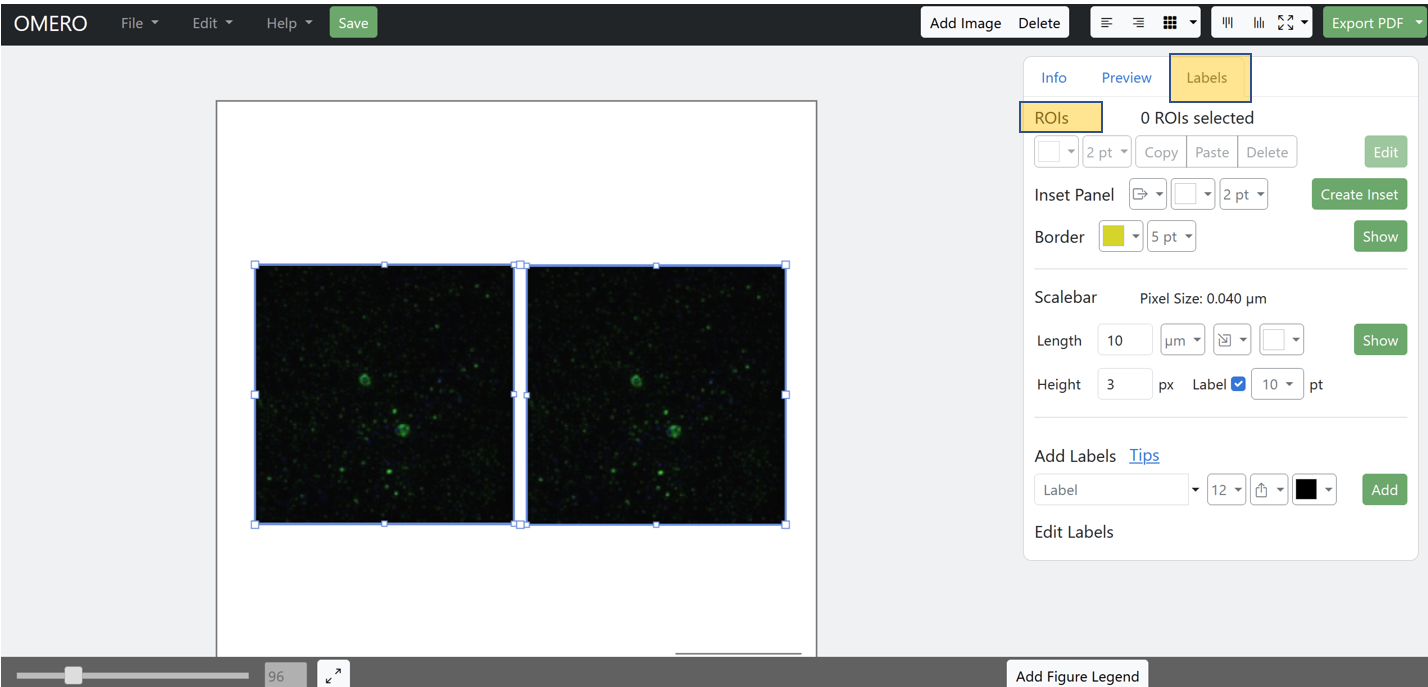
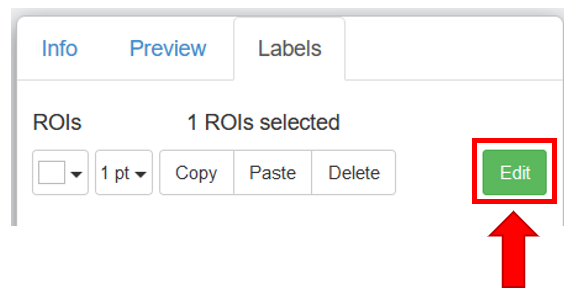
- In the Label tab, ROI section. click on
Edit
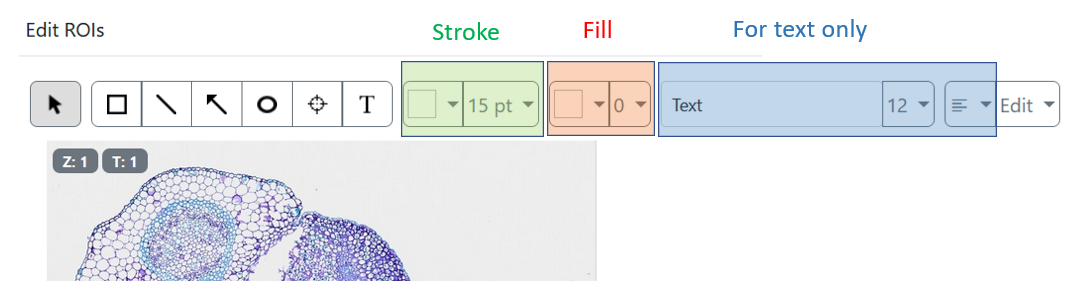
-
Select a ROI shape
- Rectangle
- Line
- Arrow
- Ellipse
- Point
- Text
-
You can change for each ROI individually
- stroke color
- stroke width (except for text ROI)
- background color
- background opacity (0 = transparent)
- text comment (only for text ROI)
- text font size (only for text ROI)
- text alignment (only for text ROI)
For text ROI, the handles are colored in black to show which text alignemnt you've selected

- When finised, click on
OK
¶ Add existing ROIs
- In the Label tab, ROI section. click on
Edit
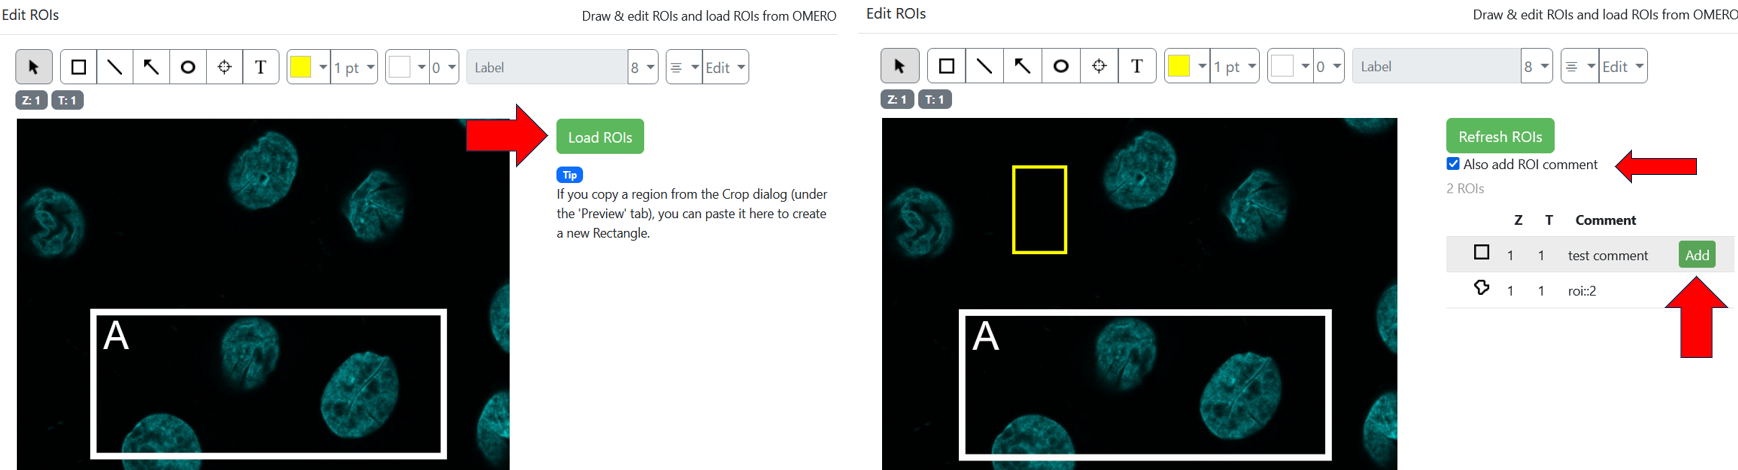
- On the popup window, click on
Load ROIs. The list of all ROIs that are attached to the image in the webclient is displayed. - Move your mouse on the displayed ROIs and click on
Addto add them to the figure
Note: If you would like to import the ROI comment as well, check the corresponding box
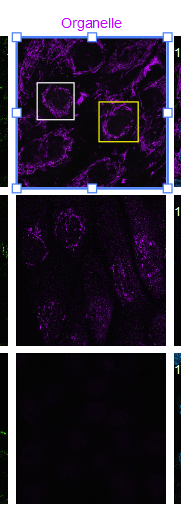
¶ Copy/Paste ROIs
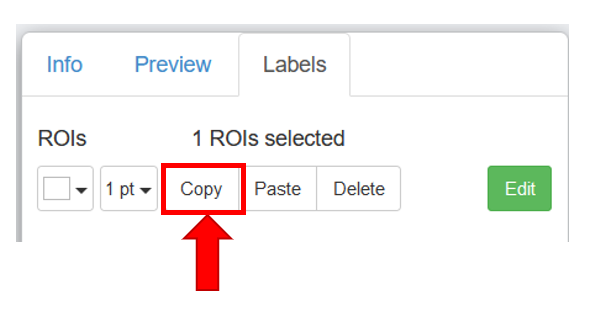
¶ Copy all the ROIs at once
- Select an image with some ROIs
- In the ROI section, click on
Copy
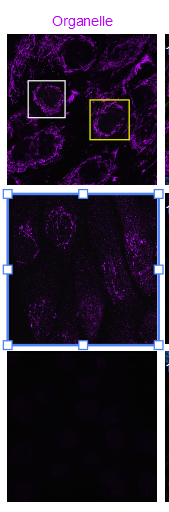
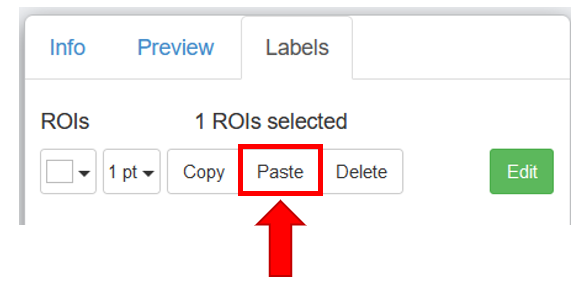
- Select another image.
- In the ROI section, click on
Paste - ROIs are copied at the same position on the other image.
You can change the color and the border width of all ROIs at once if you you use buttons in the ROIs section.
¶ Copy ROIs one by one
- Select the reference image
- Under
labeltab, underROIs, click onEdit - Select the ROI to copy
- Click on
Edit -> Copy shapes - Close the window
- Select the target image
- Under
labeltab, underROIs, click onPaste
¶ ROIs and rotated images
- You can follow the below tutorial to correctly create ROIs with rotated images.
- In all case, you should apply the rotation AT THE VERY END of your figure !
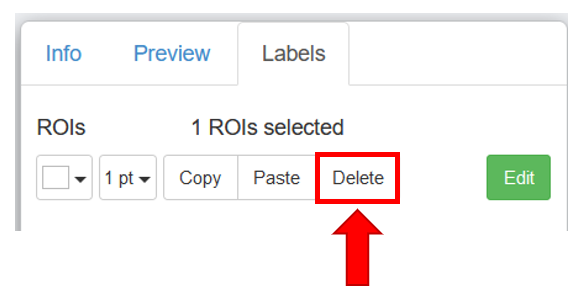
¶ Delete ROIs
- Select an image with some ROIs
- In the ROI section, click on
Delete
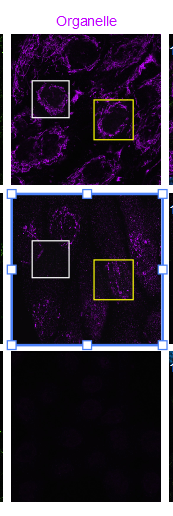
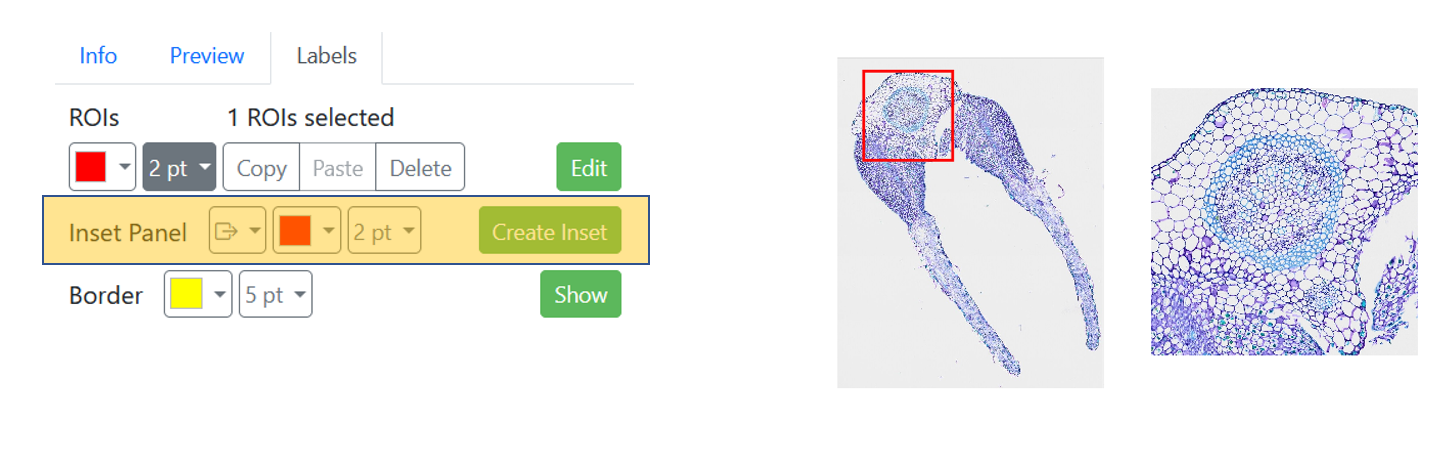
¶ Creating insets
To create a crop of an image, synchronized with the original image, you can click on Create inset, under ROIs tab.
By synchronized, we mean
- Editing the preview of the inset panel (zoom, rotation, move) updates the inset ROI accordingly
- Editing the ROI position and dimensions update the inset panel accordingly
A video is available here (3 first videos)
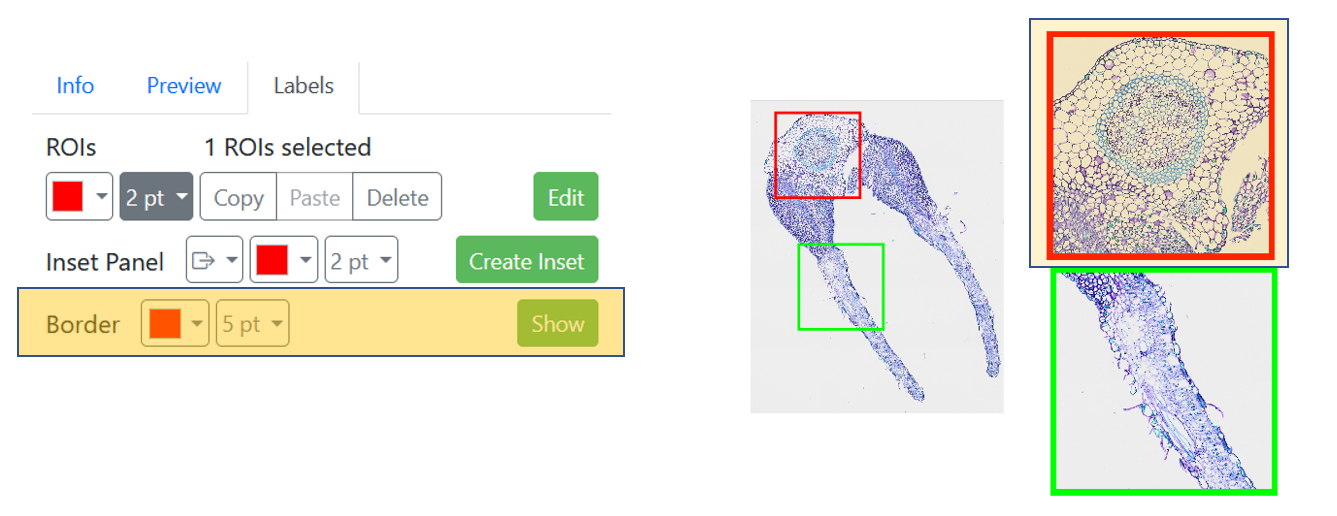
¶ Panel border
Right below the create inset, you can show/hide the panel boder, with color and stroke width selection.
Panel border can be useful to differentiate multiple insets coming from the same image
¶ Add labels
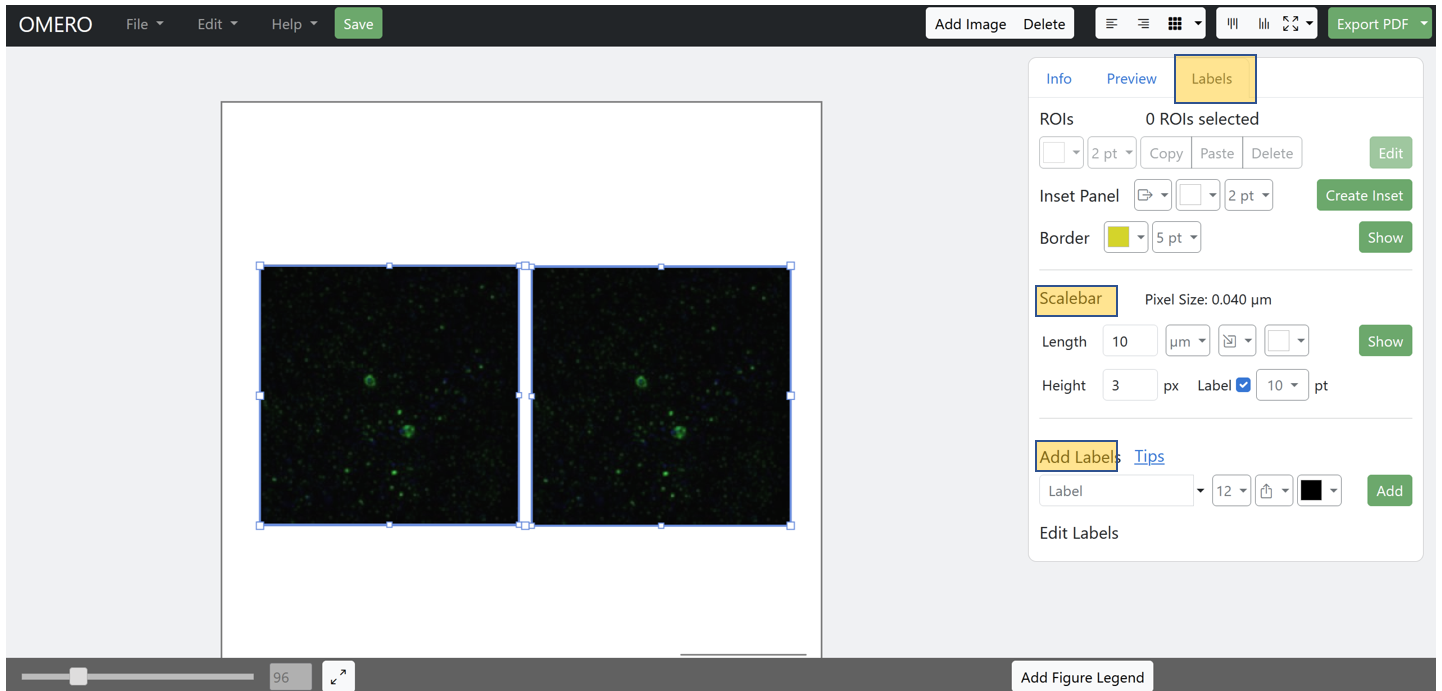
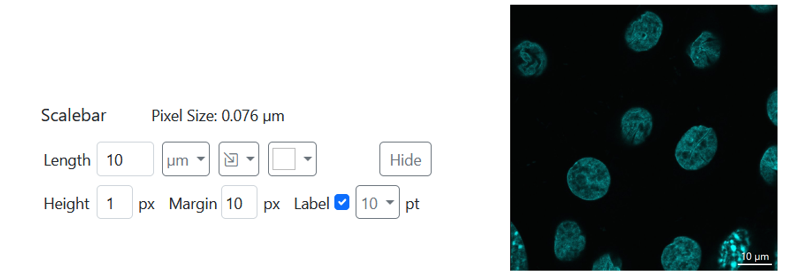
¶ Scalebar
In the Label tab, Scalebar section.
- Select the size and the unit of the scale
- Select the predefined position from the drop-down menu
- Select the color and the font size
- Select the height i.e. thickness of the scalebar
- Select the margin in pixel to fine tune the position of the scalebar from the predefined position.
- Click on
Show
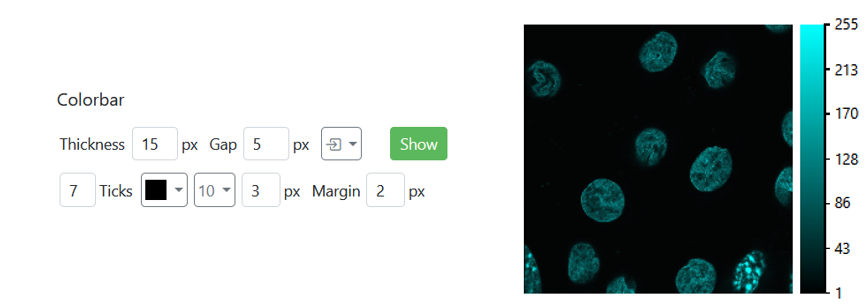
¶ Colorbar
In the Label tab, Colorbar section.
- Select the thickness of the bar
- Select the gap between the panel border and the colorbar
- Select the predefined position from the drop-down menu
- Select how many ticks to display, in which color, size and how long are the ticks
- Select the margin in pixel to fine tune how far the values are from the ticks
- Click on
Show
¶ Tags, channel name & cie
In the Label tab, Add label section.
- Click on the textbox ; a list of predefined labels is displayed (tag, key-values, timestamp, channel & image name, ...). You can select one of them or write your own one.
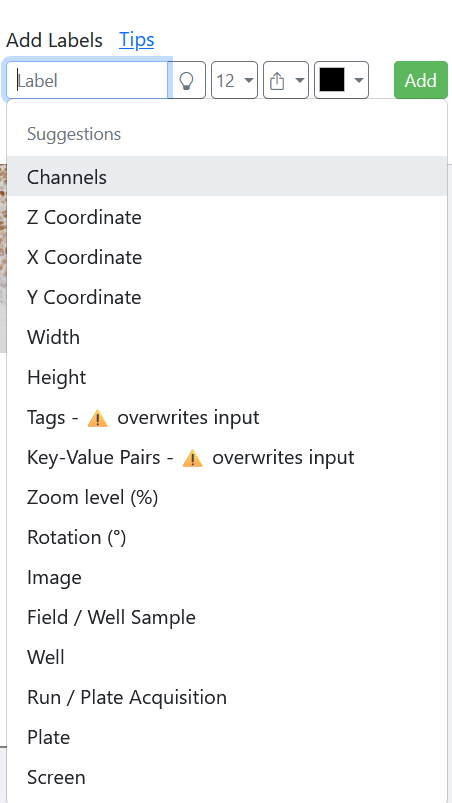
If you select a label which has options, the available options can be chosen in a new drop-donw menu.
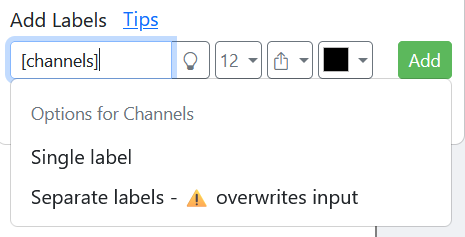
overwrites input alert indicates that, if you select this option, the content of the textbox will entirely replaced, whereas, if this alert is not present, it will add the field to the current textbox input.
Example 1: label1 + select channel separate labels = DAPI
Exampel 2: label1 + select channel single label = label1 DAPI
- Select the position where you want to show it
- Select the color and the font size
- Click on
Add
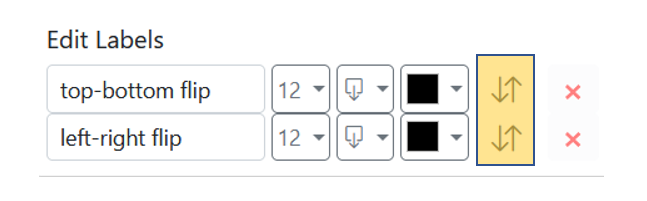
You have the possibility to edit and delete each setting after adding the label.
You can now reorder the labels by a simple drag-and-drop in the menus, using the
upside-down↑↓ arrows.
¶ Add figure legend
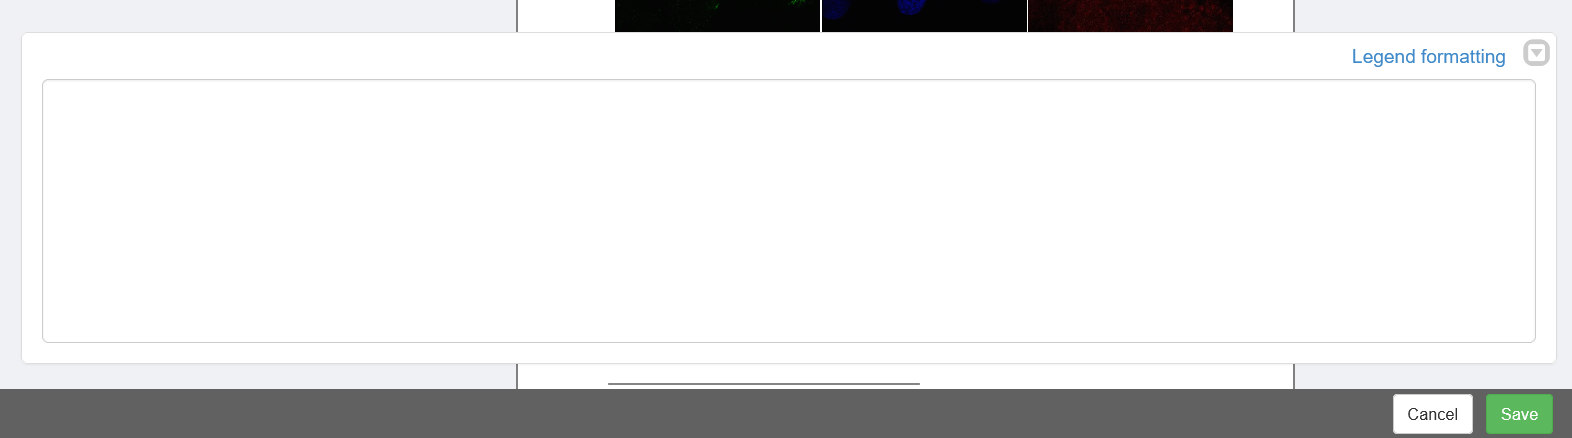
- Click on the button
Add figure legendat the bottom of the page
¶ Export and saving
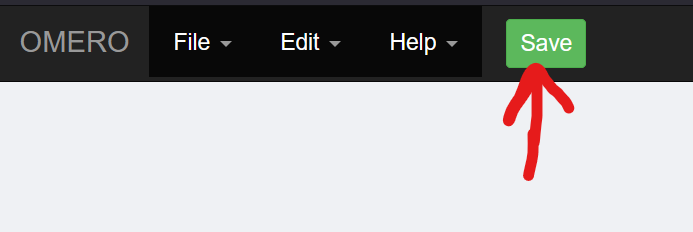
- To save you figure, click on the
Savebutton and enter the name of the figure
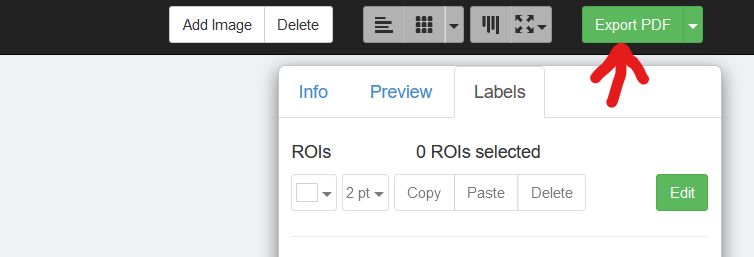
- To export, click on
Export PDF. You can also change the file format.
- Once you have downloaded the PDF, you can import it on Adobe Illustrator
If the PDF is imported on Adobe Illustrator as a single image, you can follow the steps to have access to all different components:
1. Embed the image
2. Ungroup all components
¶ Figure tracking
- Each time you save an omero.figure, a key-value pair is added to all images included in the figure
- Key : figure name
- value : figure URL
![]()
- Each time you export the figure (as pdf or as tiff), the pdf or tiff is liniked as attachment to all images included in the figure
![]()